 PRINCIPLES PRINCIPLES
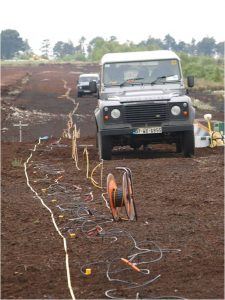
The technique utilizes pairs of current and potential electrodes inserted into the ground. By measuring the voltage between the potential electrodes the apparent resistivity of the subsurface can be determined. By taking a large number of resistivity readings using different geometrical arrays a 2-dimensional profile of the subsurface can be generated.
Profiles can be up to 635m long and investigate the subsurface to a depth of 100m. The electrodes are connected by a multicore cable to a field computer. Data are processed in the field as an initial quality control check.
The data is inverted using the Res2dinv/Res3dinv imaging software to produce an apparent resistivity depth model (below). Material types and properties can then be assigned based on the geophysical data in conjunction with available geological data.
RESULTS
 Materials such as silt, clay, peat, fill and wet ground tend to have low resistivities while sand and gravel tends to have high resistivities. Bedrock such as mudstone and shale typically has low resistivities while reef limestone typically exhibits high resistivities. Materials such as silt, clay, peat, fill and wet ground tend to have low resistivities while sand and gravel tends to have high resistivities. Bedrock such as mudstone and shale typically has low resistivities while reef limestone typically exhibits high resistivities.
The survey results above shows steeply dipping limestone bedrock bounded by sandy gravely clay to the N. The blue represents high resistivities associated with slightly weathered limestone whereas the orange to reds represent the higher conductivities associated with clay rich overburden. Highly weathered limestone is shown by resistivity values between the two extremes. |